X-Ray FuelSpray Collaborators Frequently Asked Questions

This FAQ is intended for our collaborators. It attempts to give detailed answers to technical questions that are generally of interest only to those who are already working with us.

A more general discussion of our work can be found in The X-Ray FuelSpray FAQ.

  1. Can I get a copy of the raw data?
  2. What is the file format of the raw data?
  3. What do the data file names mean?
  4. How is the raw data processed?
  5. What does "Bosch12" mean?
  6. What measurements have you done?
  7. What is the format of the so-called "Snapshots" file?
  8. Can I get some sample data?
  9. How can I generate an image of the spray from the "Snapshots" file?
  10. How is the mass calibration performed?
  11. What electrical/plumbing connections are available?
  12. Technical Capabilities and Limitations


1. Can I get a copy of the raw data?


Yes, we are willing to share the "raw" data.  However, we recommend against it.  Raw data refers to the detector signal which is recorded by the digitizing oscilloscope and written to disk.  Because the x-ray beam is pulsed and the pulse width (few ns) is much narrower than the spacing between pulses (~150 ns), the vast majority of what is recorded by the digitizer is zeros (actually detector dark current).  Therefore, the raw data consists of huge files containing a relatively small amount of useful information.  We have developed software that automates the process of picking through these files for the useful stuff, and then writes a much more compact version of the data which is easier to share with collaborators.

2. What is the file format of the raw data?

See the following for a description of the raw data file formats.

RawDataFormats.html


3. What do the data file names mean?

See the following for a description of the file naming convention.

FileNamingConvention.html


4. How is the raw data processed?

See the following for a description of the procedure used to generate the time dependent mass data from the raw data.

APDDataProcessing.html


5. What does "Bosch12" mean?

"Bosch12" is the name we have given to one particular group of  measurements.  You might also see experiment titles such as "Bosch8", "Delphi2" or  "DDC2". Each of these indicates a set of measurements on a particular injector done in the same time period.  "Bosch12" encompasses all measurements done using that injector during a particular stretch of beam time, typically one or two weeks.  In this particular case, "Bosch12" included measurements at two different injection pressures, four different ambient pressures, two different ambient gases, and two different nozzles  All of these were measured over a period of two weeks, and all of them together form the experiment "Bosch12".

The experiment title is very important for specifying the conditions of any particular measurement.  Our measurement techniques are constantly evolving; our data acquisition is constantly modified and improved, software is changed, data file formats are updated, new pressure vessels are built, the fuel is changed, etc.  The experiment title is one way of uniquely identifying all of those characteristics.

All data files are named based on the experiment title.


6. What measurements have you done?

The link below shows the details of all the measurements we have performed:

ExperimentParameters.pdf

Much of the information in this file will be meaningless to those outside our group.


7. What is the format of the so-called "Snapshots" file?

The radiography data is stored in a file format that we call the "Snapshots" file, because the data is arranged so that each column contains all the data for one snapshot in time. The "Snapshots" file is a single data file that contains all the measurements of a spray under a single set of parameters. It contains the time-dependent measurements of the mass/area of fuel at each of the position coordinates.  The file is typically plain ASCII text for portability, values are separated by tabs or spaces.  The format is defined as follows:

FILETYPE=SNAPSHOT UNITS=MICROGRAMS/MM^2 MUMASS=0.002415


#x_position
y_position
time(1) time(2) ... time(N)
x(coordinate1) y(coordinate1) mass(t1) mass(t2) ... mass(tN)
x(coordinate2) y(coordinate2) mass(t1) mass(t2) ... mass(tN)
... ...
...
...
...
...
x(coordinateM) y(coordinateM) mass(t1) mass(t2) ... mass(tN)


The first row of the snapshots file is a header. It contains the string "FILETYPE=SNAPSHOT", which can be used by the data processing code to identify the file format. It may also contain other "key=value" pairs that denote the units that are tabulated in the file.

The second row of the snapshots file is also a header.  It starts with the string literals "x_position" and "y_position", followed by the time values (in seconds) for each of the remaining columns.  The remaining rows of the file contain measurements made at individual position coordinates.  These are described by their x and y coordinates which are in given in the first two columns of each row.  The remaining columns give the mass value in micrograms measured at that position coordinate for the time indicated by the column header.

Each file can contain any number of rows >1, any number of columns >2.

The index "N" in the table above is sometimes referred to as the "Snapshot Number" by our group, and can be considered as an index of the time after the start of data acquisition..

A typical experiment might have 540 time values ("snapshots"), with measurements at 1500 position coordinates.  This results in a snapshots file of about 20 MB.  Note that a Microsoft Excel spreadsheet can only have a maximum of 256 columns, so you may not be able to view the entire data file using Excel.  We typically use Origin, Matlab, or our own custom software to work with these data files.


8. Can I get some sample data?

Sure!  Click the link below to download a small Snapshots file that contains part of the measurements of a spray from a diesel injector.

SampleSnapshotsFile.dat    8232 kb


9. How can I generate an image of the spray from the "Snapshots" file?

From the data in the snapshots file, images of the spray can be generated, however, the process is not always straightforward. Though the radiography data is measured in an approximate grid, this grid is sparse and it is usually not regular (not evenly spaced). There are two main steps to generating an image:
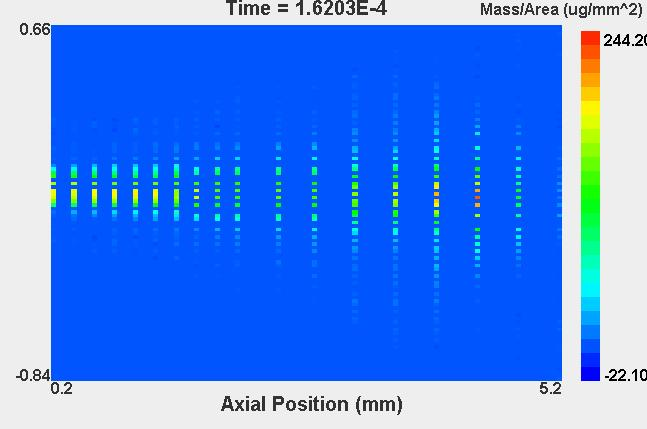
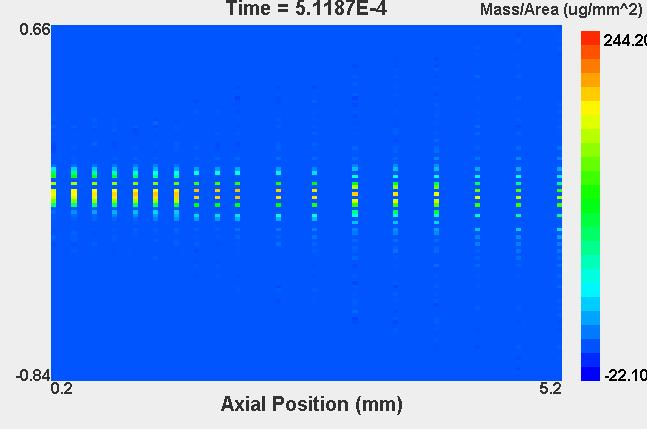
  1. Force the data into a regular grid. The dimensions of the grid is an arbitrary choice. A larger grid will show smaller features, but will use more memory, and more extensive interpolation will be required to fill the gaps.  Below are two images that show the results of this process for the snapshots file above. These images were generate from the 44th and 139th columns of mass/area data in the file, respectively.  The dimensions of the grid chosen for these images are 100 x 100.

    Uninterpolated image of spray forced to fit regular grid Uninterpolated image of spray forced to fit regular grid.
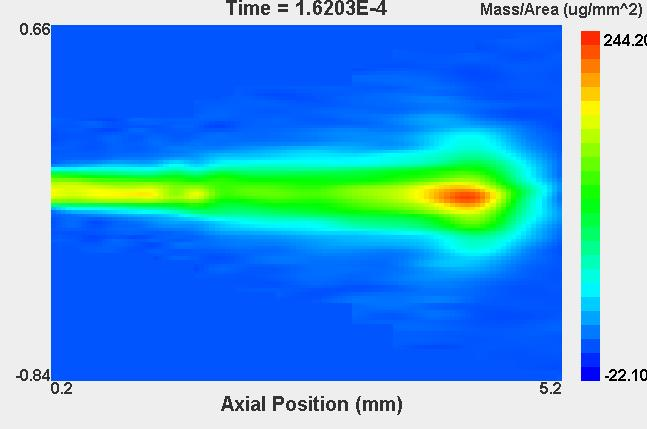
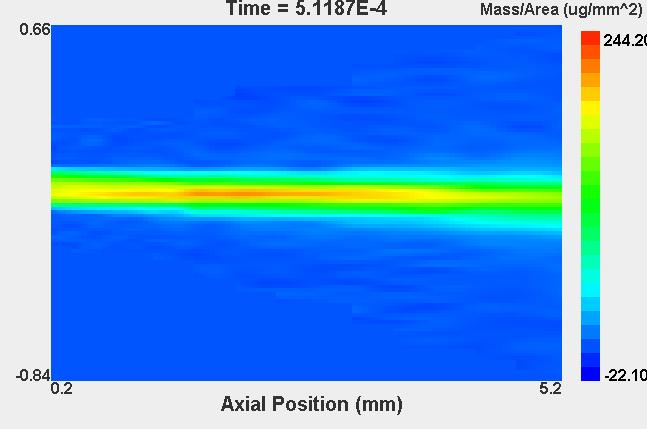
  2. Interpolate between measurements to fill the empty spaces in the grid. The next pair of images use the same data as the previous pair, but this time the empty spaced in the grid have been filled by interpolating across the missing elements.
    Interpolated image of spray Interpolated image of spray
This process of forcing the data to fit a regular grid and then interpolating "distorts" the original data. The images generated should not be used for data analysis purposes, merely for visualization.

We have software written in Matlab and in Java that automates this process, and we are willing to share these with collaborators.


10. How is the mass calibration performed?

The mass calibration allows us to convert our measurement of x-ray absorption into a measure of the mass of fuel in the path of the x-ray beam. The relationship between the measured x-ray intensity is given by:
I/Io = exp(-mu * M)
Where I and I0 are the transmitted and incident intensities, µM is the absorption coefficient, and M is the mass density of fuel in the path of the beam.  The absorption coefficient varies with the x-ray wavelength and changes with fuel composition.  This single constant allows us to relate the intensities which we measure to the mass of fuel.

The value of the absorption coefficient is determined by measurements of fuel samples in capillary tubes.  First the dimensions of the capillary tubes must be determined.  This is done by measuring the x-ray transmission through the clean capillary tube when empty (filled only with air).  Next, the same tube is filled with high-purity water and the transmission of the water-filled tube is measured.  The absorption due to the tube itself can be subtracted from this measurement, leaving only the absorption due to water.  Since the absorption of water is precisely known for any x-ray wavelength, this series of measurements can be used to determine the path length through the water that the x-rays traveled.  This path length is the inner diameter of the capillary tube. [Note that the nominal tube diameter (700 or 1000 microns) is much larger than the size of the x-ray beam (typically <50 microns in this dimension), so the roundness of the tube is neglected in this calculation, assuming that the inner walls of the capillary tube are planar and perpendicular to the x-ray beam.]

Now that the tube has been accurately characterized, it is drained of water and refilled with fuel.  The x-ray transmission of the fuel plus the tube is then measured, and the effect of the tube is again subtracted.  This leaves only the contribution of the fuel, and since the path length is known the absorption coefficient per unit path length can be determined. 

Throughout these measurements care is taken to make sure that the capillary tubes are always mounted in the same position with respect to the x-ray beam.  This minimizes effects from variations in the wall thickness of the tube, both along its length and around its diameter.  Successive trials are performed using at least three different tubes and the results are averaged to determine the final value of the absoption coefficient. 

We typically use tubes made of quartz or kapton. The kapton tubes have the advantage that they have very low absorption.


11. What electrical/plumbing connections are available?

See the following for a description of the mechanicals at the 7-BM-B hutch:

APSHutchConfiguration7BMB.html


12. Technical Capabilities and Limitations

Injection Pressure
For our diesel spray work, we currently use a Bosch Generation 1 CP1 pump. This pump is capable of a range of fuel pressures from ~150 to 1350 bar.  We also have a Bosch Gen 2 pump and rail which is capable up to 1600 bar. For gasoline injectors, we use a bladder accumulator to generate pressurized fuel, this can deliver fuel at pressures up to 3000 psi.
Ambient Pressure
We use several different spray chambers that each have different pressure capabilities. The maximum achievable pressure is restricted by our x-ray windows. In general, we can measure sprays under ambient pressures from 1 to 35 bar absolute. However, as we move to higher ambient pressures, we must use x-ray windows with a smaller field of view. The windows and their capabilities are summarized in the following table.

Existing x-ray windows and their pressure capabilities.
Window
Effective Field of View
Pressure Range
38 x 122
35 mm x 115 mm
1 bar absolute
3 x 22
2.5 mm x 18 mm
1-35 bar absolute
12 x 30
11 mm x 26 mm
1-5 bar absolute

Injectors
Our diesel spray research primarily uses Bosch light-duty injectors and we are fully equipped to test those nozzles and injectors. Given the proper mechanical adapters and electrical control unit, we can accomodate injectors by other manufacturers. Our gasoline spray research has used injectors from several different manufacturers, each with their own proprietary controller.
Spray Nozzles
We have a number of different Bosch diesel spray nozzles on hand. Most of our studies have been done on research nozzles with single holes that lie on the injector axis. We also have a number of production or "near-production" multi-hole nozzles.
Spray Duration
For our diesel spray research, we use a Genotec injector driver. This driver enables the Bosch injectors to be energized for a duration as short as approximately 300 microseconds, and as long as a few milliseconds.  In general, these injectors reach a quasi-steady-state after about 500 microseconds, so durations longer than 1 ms are not typically studied.
Temperature
We currently are not capable of measuring sprays under high ambient temperature conditions. We are exploring the possibility of heating our spray chamber, but this will require either a new x-ray window design or significantly reduced ambient pressure.

We are capable of working with elevated fuel temperatures, and in fact we have a fuel system and spray chambers that are expressly designed for this.